As data curators, we constantly need to work with messy data and metadata. OpenRefine is a popular open-source tool for cleaning and transforming data. This tutorial will teach you how to use OpenRefine to clean metadata pulled from Socrata open government data (OGD) portals. To begin, we will use Socrata's Discovery API to retreive metadata. Once we have the metadata, you will learn to perform format transformation, duplicates checking, columns splitting, and exploratory analysis with OpenRefine. Once the tutorial is complete, you will know various methods for cleaning data using OpenRefine.
Learning Objectives
- Use an API to collect data from public data sources such as open government data portals.
- Use OpenRefine to clean data.
Prerequisites
- Computer and internet access
- Basic understanding of open data and data repositories
- Basic knowledge of popular open data portal software providers (CKAN, Socrata, Dataverse, etc.)
- Basic knowledge of common web exchange file formats, such as JSON, XML, and CSV
- Basic knowledge of any programming language is helpful, but not required
- Basic knowledge of API (View our API tutorial)
Introduction to OpenRefine
In some ways, OpenRefine is similar to spreadsheet software programs, such as Microsoft Excel or Google Sheets. Like OpenRefine, spreadsheet software programs handle tabular data, and usually allow sharing among different users. However, OpenRefine can also interact with data formats frequently used in web environments, such as HTML, JSON, XML — whereas Excel and Google sheets may not support these formats. To download OpenRefine and to proceed with this tutorial, visit this download link http://openrefine.org/download.html. Once installed, click the OpenRefine icon, and this will automatically open a browser window showing the OpenRefine workspace.
Example
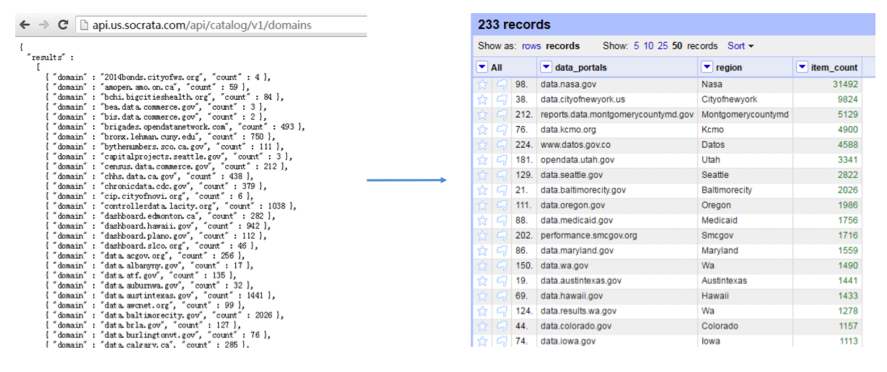
This example details how to maintain a table of all open data portals (most of which are open government data portals) supported by Socrata, including the number of resources each portal hosts and the regional government or organization each portal represents. The data used in this example can be retrieved via the Socarata API in JSON format using the following link: http://api.us.socrata.com/api/catalog/v1/domains. The steps below will explain how to use OpenRefine to transform this data into tabular format.
Please refer to our previous tutorial “APIs for Open Government Data” to learn data retrieval via APIs.
Step 1: Create project
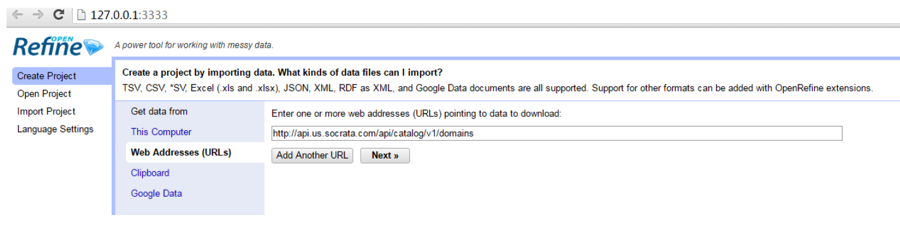
In your browser, choose create project from “Web Addresses (URLs)” and paste the API call http://api.us.socrata.com/api/catalog/v1/domains. This allows OpenRefine to retrieve data directly from API so that we do not need to download the data.
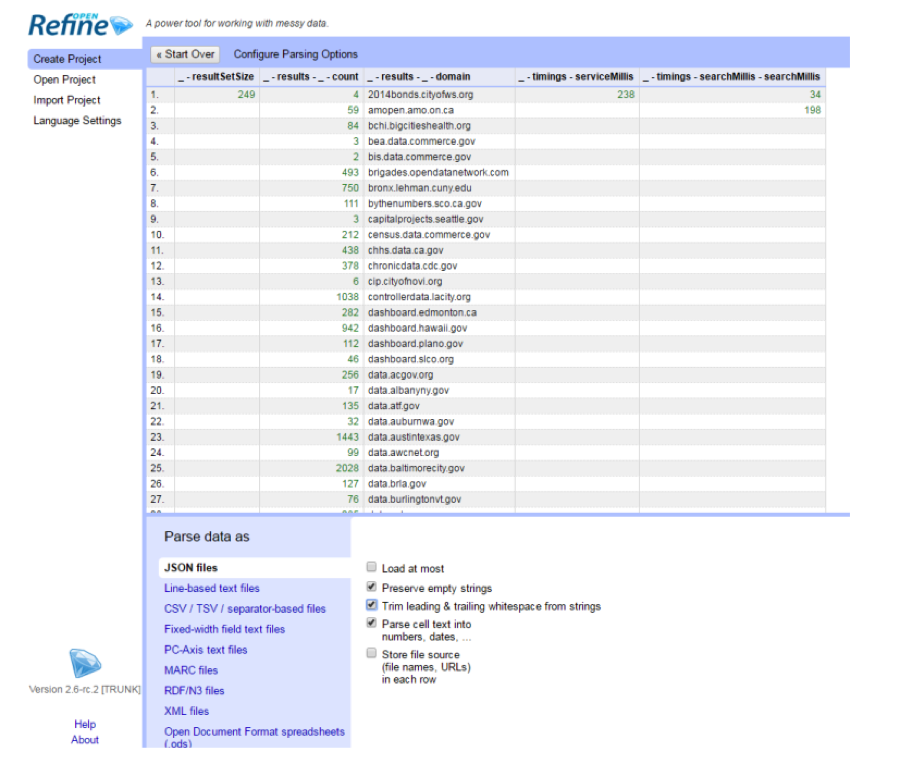
Check the following boxes: “Parse cell text into numbers, dates” and “Trim leading and trailing whitespace from strings” and click “Create Project”.
Step 2: Remove and rename columns
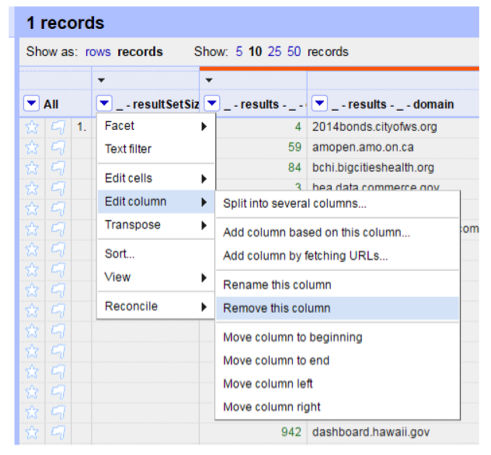
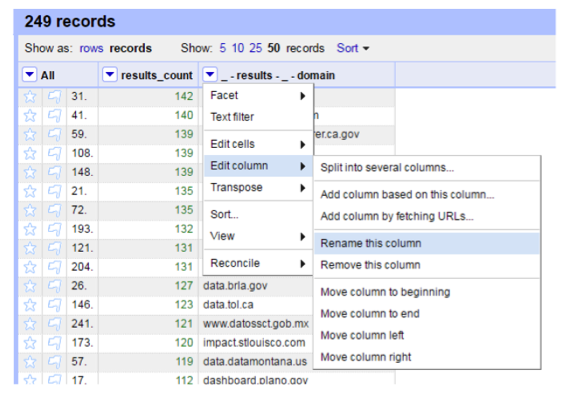
Now we can see that the JSON format data has been converted into a table. But there are columns from the original data that we do not need, for example, the “resultSetSize” element. We can delete that column by clicking the small triangle at the column name, choose “Edit column” -> “Remove this column”.
Using “Edit column” -> “Rename this column”, we could clean up column names. In this example, columns are renamed to “data_portals” and “Item_count” from “results_domain” and “result_count”, respectively.
Step 3: Check duplicates
OpenRefine makes it very easy to check duplicates based on columns. Use “Facet” -> “Customized facets” -> “Duplicates facet”, we could see in the left-hand panel, there is not any duplicate in “data_portals” column.
Step 4: Add columns and split string
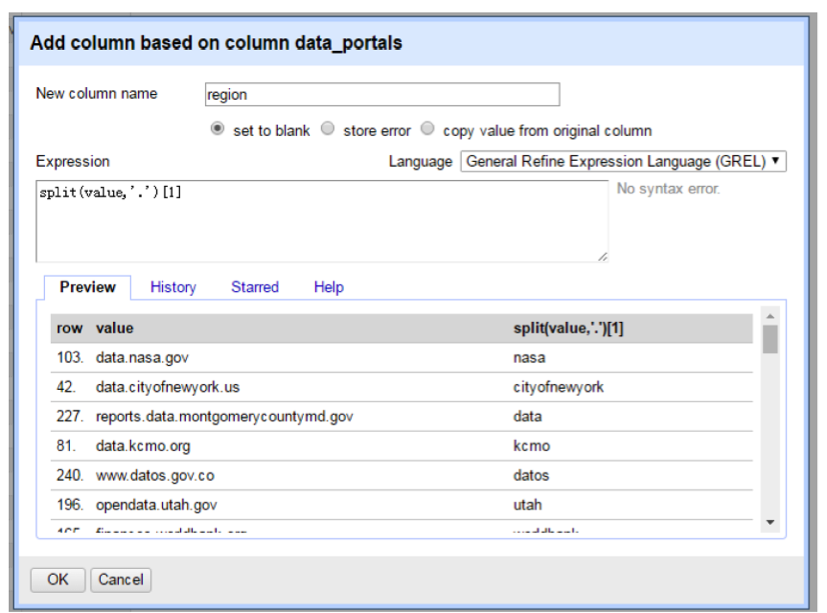
Now we want to add another column called “region” to store the names of the government or the organization hosting each portal, for example, NASA and Seattle. We could work from the urls and extract region names from them. For example, we could extract “seattle” from “data.seattle.gov”. The way we could achieve this is by splitting the urls by “.” (resulting in three elements: “data”, “seattle”, “gov”), and take the second element (“seattle”) out. We can use “Add column based on another column” to create a new column “region” based on “data_portals” column. To do that, we use the “General Refine Expression Language (GREL)” to implement splitting. Type in “split(value, ’.’)[1]” in “Expression” box to pull out the second element of the url and assign it to column “region”. For more on GREL, please visit the OpenRefine wiki page.
Step 5: Common transforms
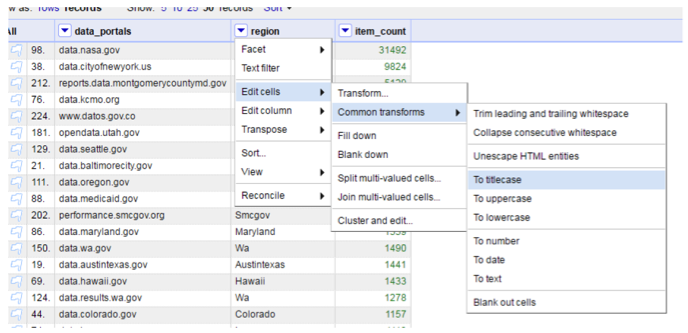
After extracting region names out from urls, we may want to format them, for example, transform them into title case. OpenRefine allows for easy transformation by providing a set of functionalities under “Edit cell” -> “Common transforms”. Let us make all region names title case.
Step 6: Customized facets and transforms
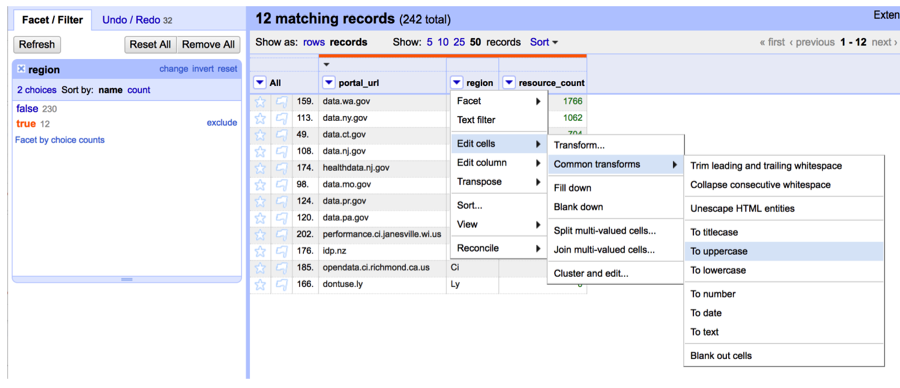
We may also want to transform state abbreviations to upper case, for example, “Wa” to “WA”. To do this, we need to first filter out region names with length of two. Again, using “Facet” tool, we can create a “Custom text facet” to choose region names with two letters. The expression goes in the “Expression box” is “length(value) = 2”.
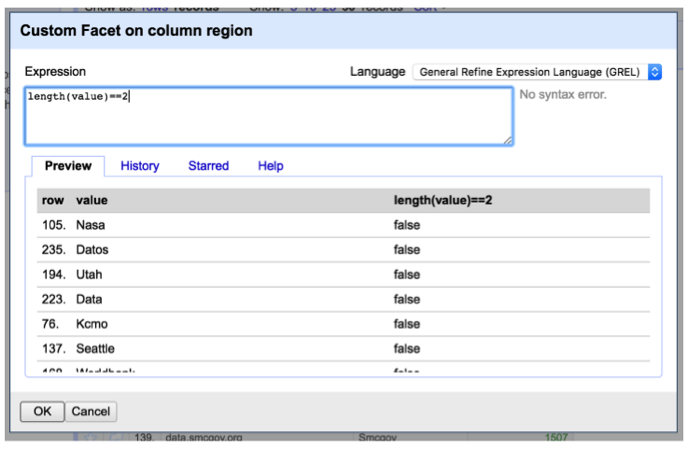
Then on the left-hand side panel, we will see that there are 12 matching records, we then use “Common transforms” to convert them to uppercase.
Step 7: Manually edit cell value
OpenRefine’s automatic data cleaning and transform functionalities have been very useful so far. However, there are still places that need manual editing. We can edit individual cell values by moving the cursor to the cell to be edited and click “edit”. We do this until every cell is satisfactory.

Step 8: Delete rows with blank cells
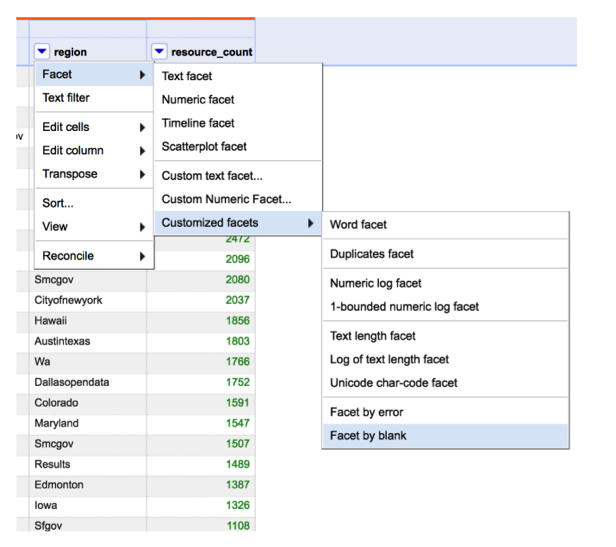
Lastly, we may want to remove the “bad values” or the “outliers”. In the original data, some urls are of invalid format. We could either manually inspect the entire dataset and remove them, or detect them using OpenRefine functionalities. For example, when we did step 4, we ran “split(value, ’.’)[1]” to extract the second element of urls. This step resulted in some blank cells since the urls are invalid, such as “stubox”. Therefore, they do not have a second element. By using the “Facet by blank” tool, we can detect those invalid urls.
Step 9: Exploratory analysis
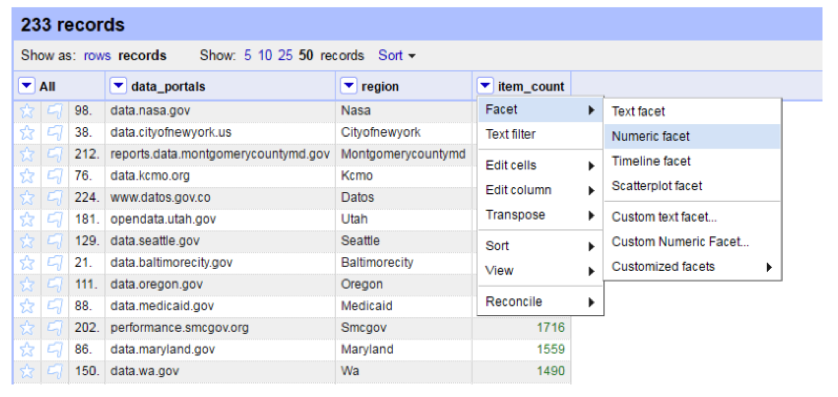
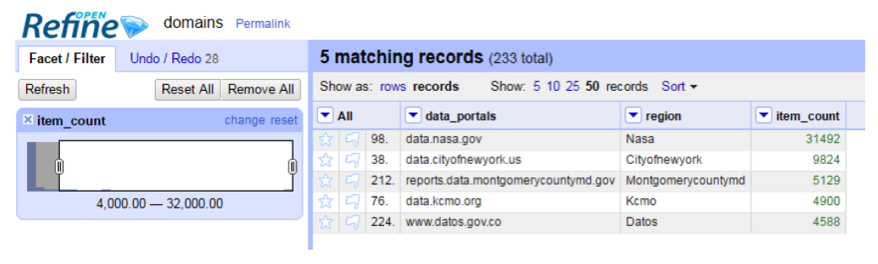
We could use OpenRefine to do some basic exploratory analysis. For example, if we are interested in examining data portals with more than 4000 resources, we could first sort the table by “item_count”, and then use “numeric facet” to filter the records.
Step 10: Export and share
Finally, we have transformed a JSON format messy data into a nice table. We can export the resulting table into a variety of formats including Excel and use the “Permalink” in the left-upper part to share the workspace with others.
Resources
- OpenRefine Github: https://github.com/OpenRefine/OpenRefine
- OpenRefine Tutorial: http://enipedia.tudelft.nl/wiki/OpenRefine_Tutorial
- More on string operation and regex: https://github.com/OpenRefine/OpenRefine/wiki/Understanding-Regular-Expressions
Creators
This material is part of Open Data Literacy Project funded by IMLS grant.
An Yan: Information School, University of Washington
Bree Norlander: Information School, University of Washington
Carole Palmer: Information School, University of Washington
Kaitlin Throgmorton: Information School, University of Washington